PORTLAND CLUSTERS 2007: VALUE ADDED (IN MILLIONS OF DOLLARS), LOCAL AND NATIONAL GROWTH RATE, AND LOCATION QUOTIENT
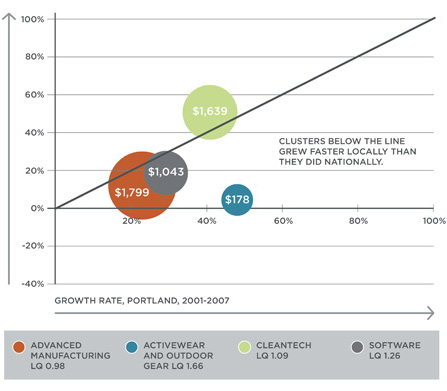
Source: IMPLAN data for the nation and the City of Portland (approximated by zip codes) for 2001 and 2007. Calculations by ECONorthwest
Note: Size of bubble shows value added in 2007. Each legend label shows the cluster’s 2007 Portland:U.S. value added location quotient. The dotted arrow has a slope of 1; clusters located to the right of the line grew faster in Portland than in the nation between 2001 and 2007.
More information about Portland city
https://www.portlandoregon.gov/
About the project: